Last updated: 30 August 2023 with the information from the Turkish Statistics Institute last released at the end of Q2 2023. If you find this useful, please consider sourcing. I'll be updating this content with new information as it is released. If you need raw data or simply want to say hi, send an email to enes at turkeythings.com.
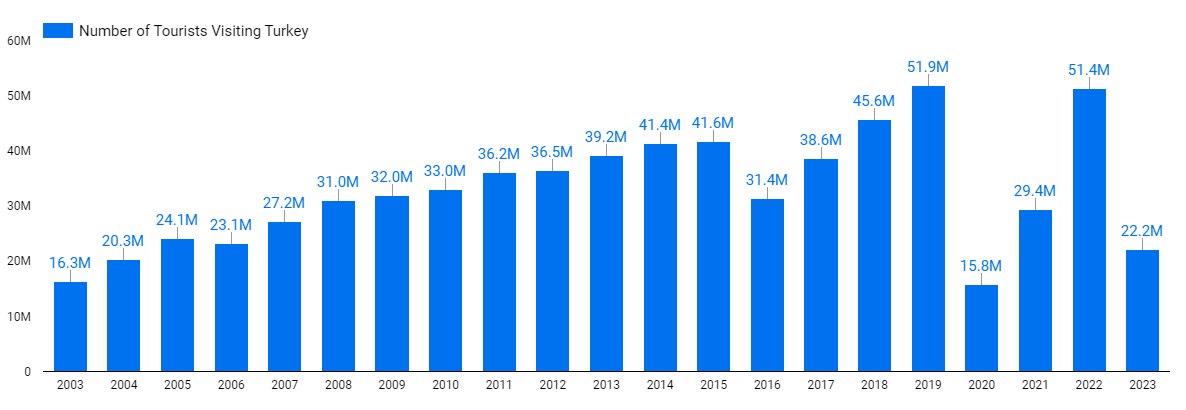
In the first half of 2023, Turkey welcomed about 22.18 million tourists, marking a robust 29.2% increase compared to the previous year, which saw around 17.39 million visitors.
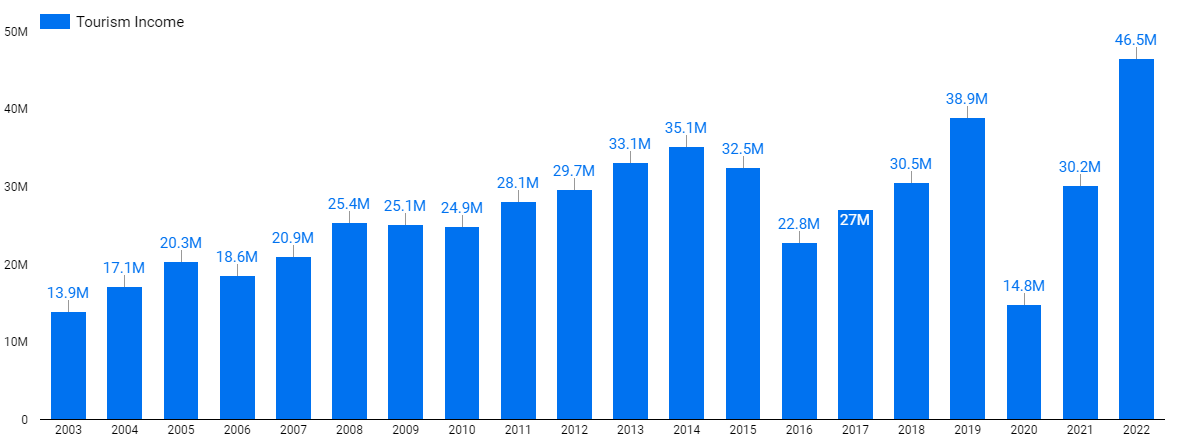
Turkey’s tourism income was $22.18 billion in the first half of 2023, marking a 20.5% increase compared to the same period last year, which had recorded $18.39 billion.
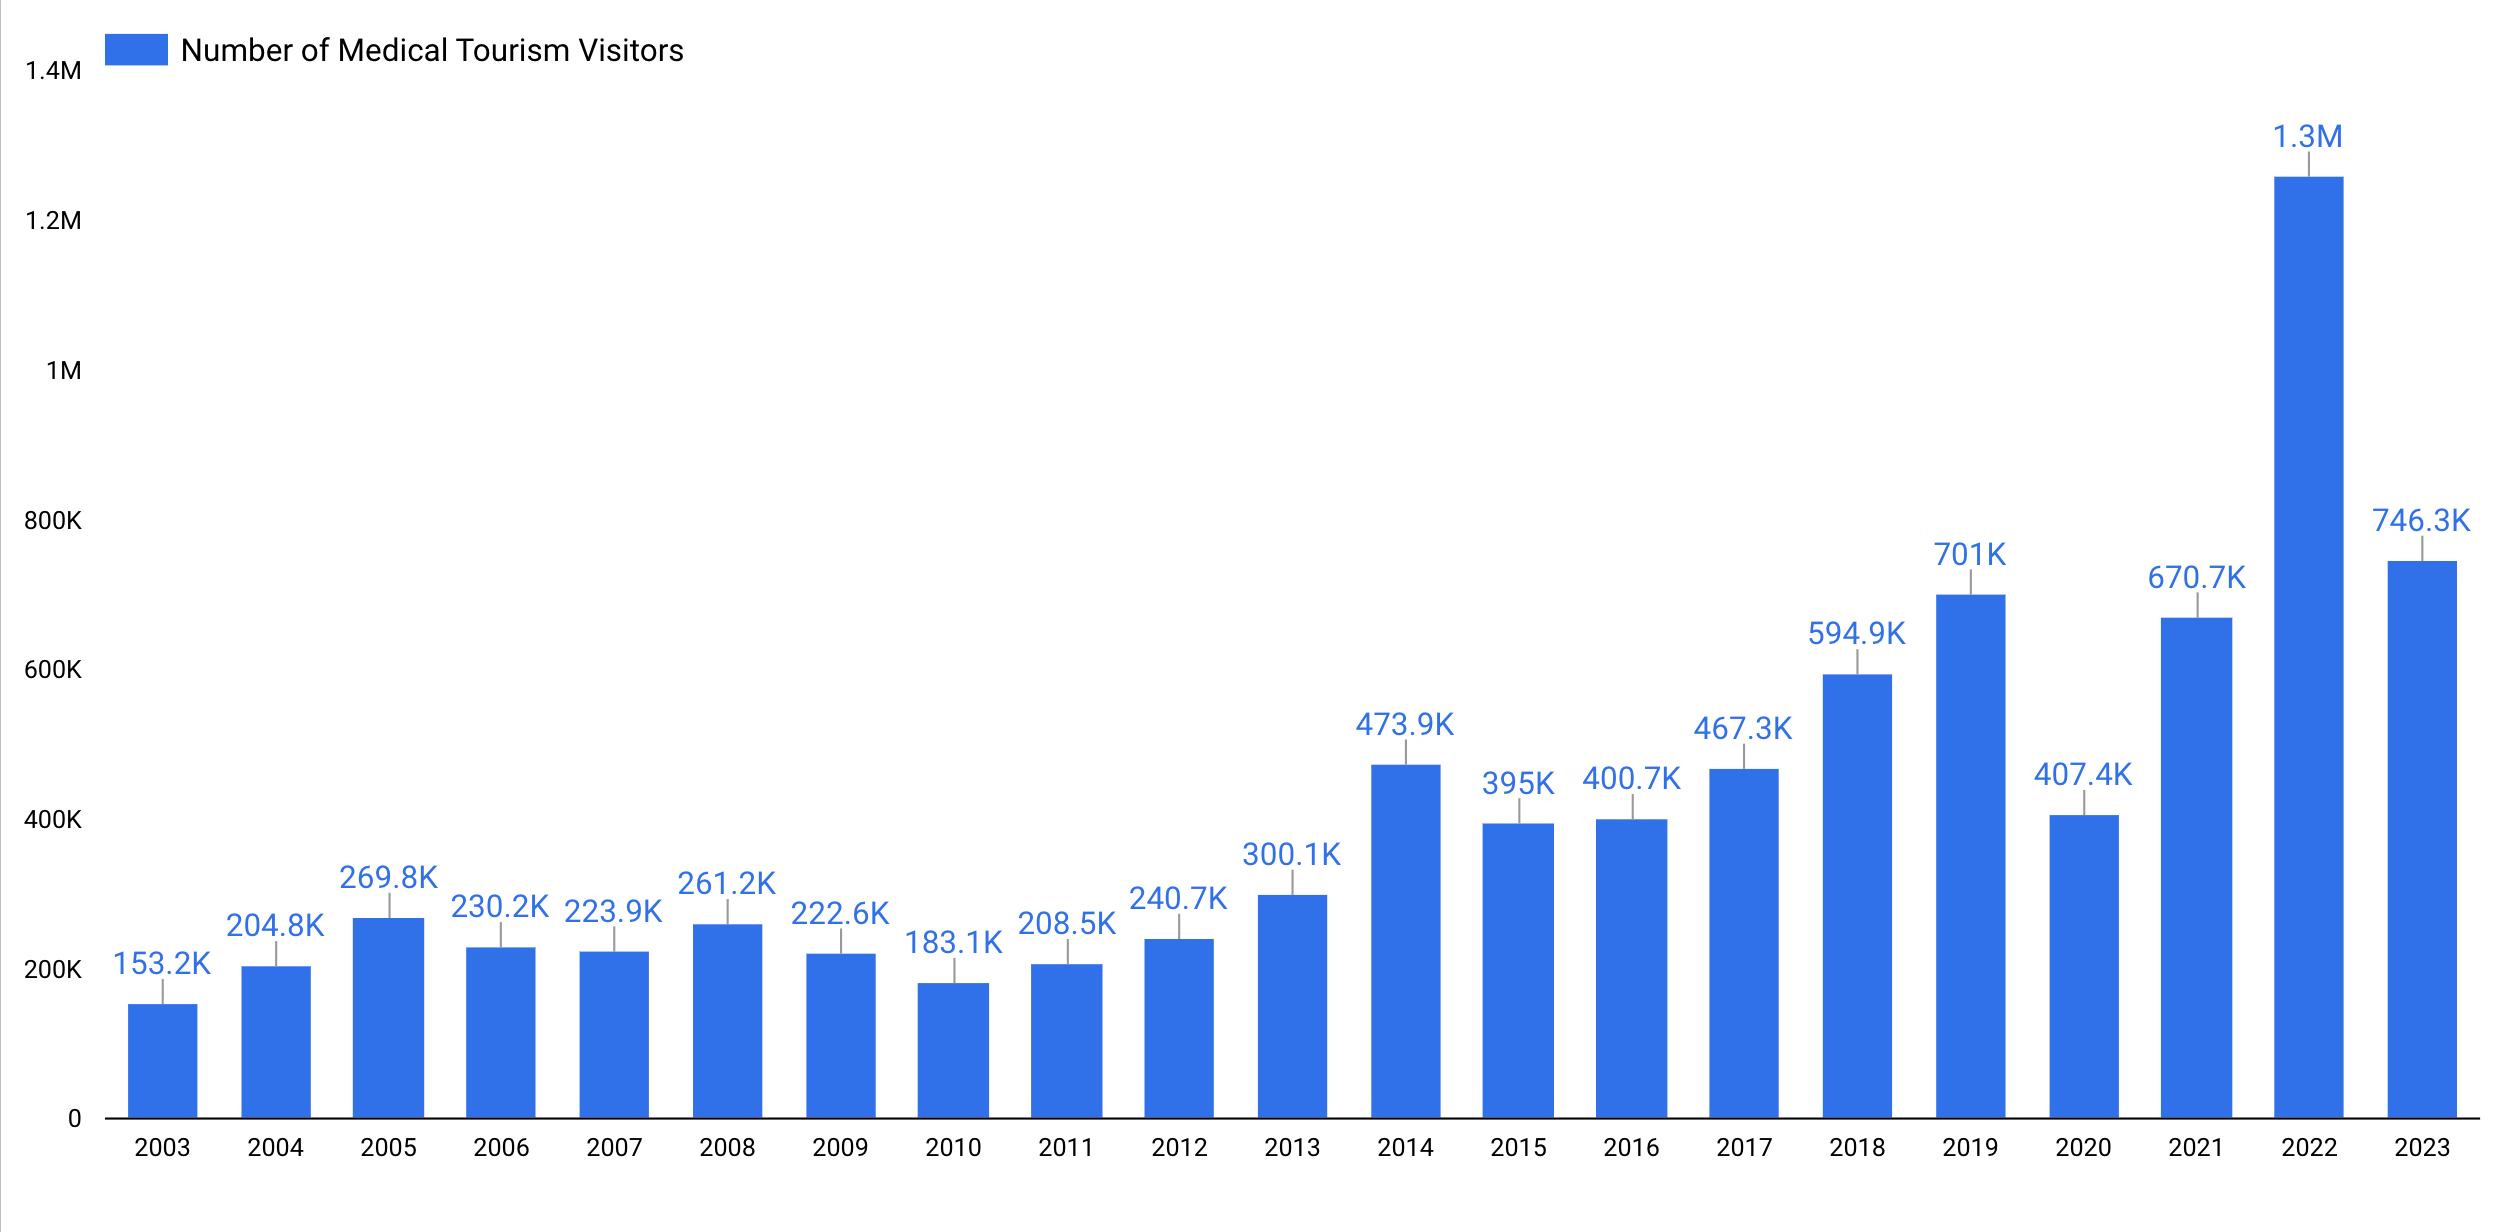
In the first half of 2023, 746,290 people visited Turkey for medical tourism. In 2022, 1,258,382 people did so, marking the first year Turkey surpassed a million arrivals for health tourism.
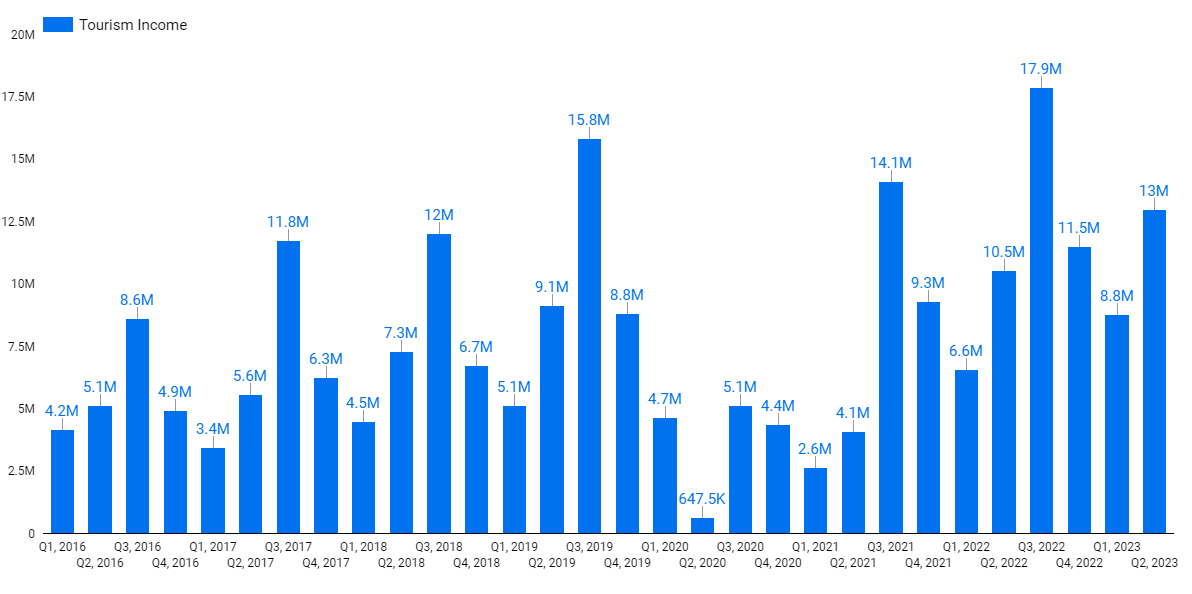
In the last quarter (Q2, 2023) Turkey’s tourism income was $12.98 billion, an increase of 23.1% compared to $10.5 billion in the same period the previous year.
Turkey’s tourism income set a record in 2022 at $46.5 billion.
The top five countries with the highest number of tourists visiting Turkey are Russia, Germany, Bulgaria, the United Kingdom, and Iran.
The US has set a new record for tourist numbers, surpassing a million visitors in 2022. This year’s projections indicate even more substantial growth, with 542,000 visitors in the first half alone, compared to the 329,000 visitors recorded in 2017.
Turkey Tourism Statistics Table of Content
Number of Tourists Visiting Turkey Yearly
Last updated in Q2 2023, thus the 2023 data is not complete. Check the quarterly report below for comparison with the last year same period.
Year
Number of Tourists
2003
16,302,053
2004
20,262,640
2005
24,124,501
2006
23,148,669
2007
27,214,988
2008
30,979,979
2009
32,006,149
2010
33,027,943
2011
36,151,328
2012
36,463,921
2013
39,226,226
2014
41,415,070
2015
41,617,530
2016
31,365,330
2017
38,620,346
2018
45,628,673
2019
51,860,042
2020
15,826,266
2021
29,357,463
2022
51,369,026
2023*
22,177,061
2023 data is for the first and second quarters. Tourist peak usually happens in Q3.
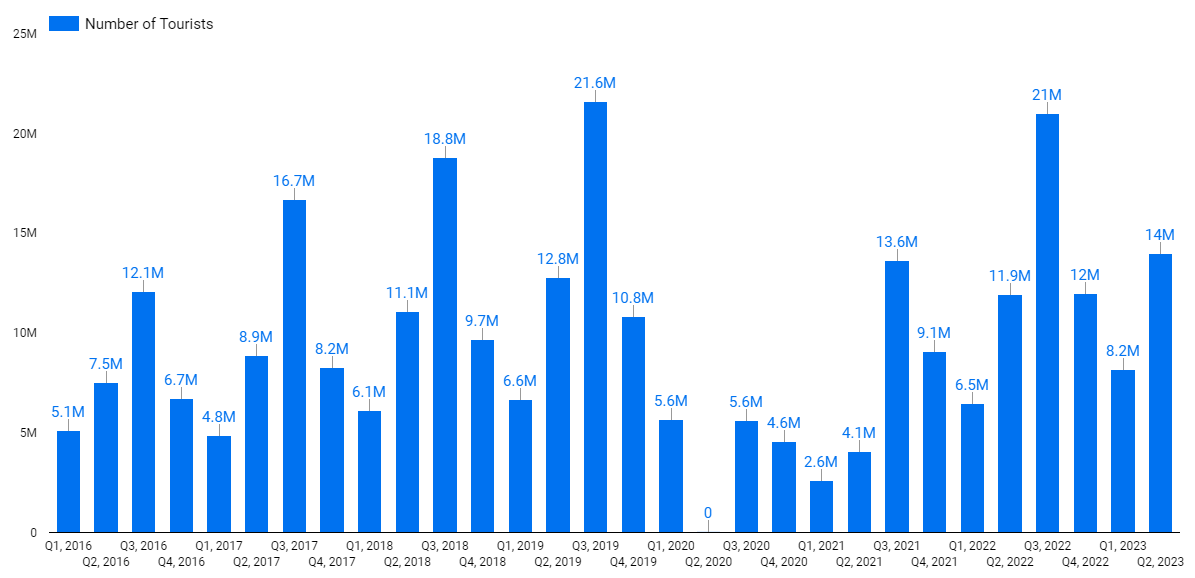
Number of Tourists Visiting Turkey Quarterly
Quarter
Number of Tourists
2016 Q1
5,107,553
2016 Q2
7,495,035
2016 Q3
12,063,311
2016 Q4
6,699,430
2017 Q1
4,844,761
2017 Q2
8,863,391
2017 Q3
16,663,265
2017 Q4
8,248,929
2018 Q1
6,122,182
2018 Q2
11,067,987
2018 Q3
18,786,765
2018 Q4
9,651,740
2019 Q1
6,644,391
2019 Q2
12,762,346
2019 Q3
21,611,964
2019 Q4
10,841,340
2020 Q1
5,639,413
2020 Q2
–
2020 Q3
5,604,155
2020 Q4
4,582,698
2021 Q1
2,600,468
2021 Q2
4,066,210
2021 Q3
13,640,672
2021 Q4
9,050,112
2022 Q1
6,451,657
2022 Q2
11,939,131
2022 Q3
21,000,128
2022 Q4
11,978,111
2023 Q1
8,181,566
2023 Q2
13,995,495
Turkey’s Tourism Income Yearly
Turkey’s tourism income x1,000 USD
Year
Tourism Income x1,000
2003
$13,854,868
2004
$17,076,609
2005
$20,322,111
2006
$18,593,950
2007
$20,942,501
2008
$25,415,067
2009
$25,064,481
2010
$24,930,996
2011
$28,115,694
2012
$29,689,249
2013
$33,073,502
2014
$35,137,949
2015
$32,492,212
2016
$22,839,468
2017
$27,044,542
2018
$30,545,924
2019
$38,930,474
2020
$14,817,273
2021
$30,173,587
2022
$46,477,871
Turkey’s Tourism Income Quarterly
Quarter
Income x1,000
2016 Q1
$4,153,890
2016 Q2
$5,135,024
2016 Q3
$8,629,735
2016 Q4
$4,920,820
2017 Q1
$3,442,495
2017 Q2
$5,585,194
2017 Q3
$11,761,803
2017 Q4
$6,255,049
2018 Q1
$4,503,731
2018 Q2
$7,289,762
2018 Q3
$12,025,329
2018 Q4
$6,727,102
2019 Q1
$5,126,534
2019 Q2
$9,135,322
2019 Q3
$15,843,017
2019 Q4
$8,825,602
2020 Q1
$4,664,392
2020 Q2
$647,474
2020 Q3
$5,122,305
2020 Q4
$4,383,102
2021 Q1
$2,635,969
2021 Q2
$4,104,082
2021 Q3
$14,126,732
2021 Q4
$9,306,804
2022 Q1
$6,570,196
2022 Q2
$10,537,381
2022 Q3
$17,875,112
2022 Q4
$11,495,182
2023 Q1
$8,759,058
2023 Q2
$12,975,307
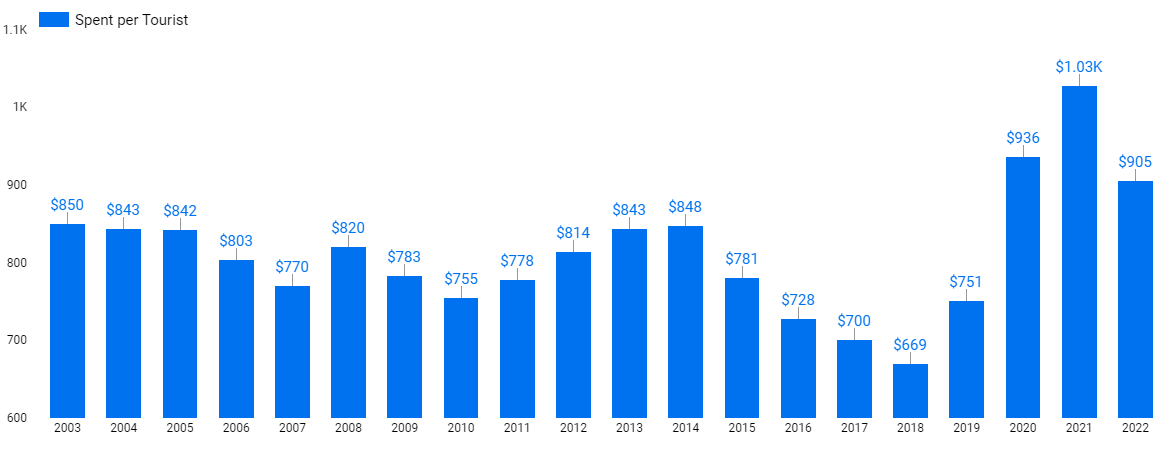
Average Spent per Tourist Yearly
Year
Average Spent
2003
$850
2004
$843
2005
$842
2006
$803
2007
$770
2008
$820
2009
$783
2010
$755
2011
$778
2012
$814
2013
$843
2014
$848
2015
$781
2016
$728
2017
$700
2018
$669
2019
$751
2020
$936
2021
$1,028
2022
$905
Number of Tourists Visiting for Medical/Health Tourism Yearly
Year
Medical Tourism Visitors
2003
153,224
2004
204,790
2005
269,800
2006
230,171
2007
223,882
2008
261,240
2009
222,597
2010
183,070
2011
208,525
2012
240,683
2013
300,101
2014
473,896
2015
395,019
2016
400,698
2017
467,302
2018
594,852
2019
701,046
2020
407,423
2021
670,730
2022
1,258,382
2023 (half-year)
746,290
Number of medical tourism tourists, yearly.
Tourist Arrivals by Country
Rank
Country
6/2023
2022
2021
2020
2019
2018
2017
1
Russia
2,614,029
5,232,611
4,694,422
2,128,758
7,017,657
5,964,631
4,715,438
2
Germany
2,270,127
5,679,194
3,085,215
1,118,932
5,027,472
4,512,360
3,584,653
3
Bulgaria
1,307,246
2,882,512
1,402,795
1,242,961
2,713,464
2,386,885
1,852,867
4
United Kingdom
1,489,304
3,370,739
392,746
820,709
2,562,064
2,254,871
1,658,715
5
Iran
1,004,742
2,331,076
9,618
385,762
2,102,890
2,001,744
2,501,948
6
Georgia
754,577
1,514,813
291,852
410,501
1,995,254
2,069,392
2,438,730
7
United States
542,276
1,013,478
371,759
148,937
578,074
448,327
329,257
8
Poland
531,610
1,135,903
585,076
145,908
880,839
646,365
296,120
9
Iraq
469,947
1,208,895
836,624
387,587
1,374,896
1,172,896
896,876
10
Netherlands
442,136
1,244,756
645,601
271,526
1,117,290
1,013,642
799,006
11
Romania
380,650
886,555
496,178
269,076
763,320
641,484
423,868
12
France
366,644
986,090
621,493
311,708
875,957
731,379
578,524
13
Israel
356,764
843,028
225,238
129,677
569,368
443,732
380,415
14
Ukraine
346,313
675,467
2,060,008
997,652
1,547,996
1,386,934
1,284,735
15
Kazakhstan
335,379
712,136
366,076
137,213
455,724
426,916
402,830
16
Azerbaijan
328,013
683,834
470,618
236,797
901,723
858,506
765,514
17
Greece
296,038
569,795
157,723
136,305
836,882
686,891
623,705
18
Saudi Arabia
286,008
497,914
10,083
67,490
564,816
747,233
651,170
19
Italy
224,136
420,661
116,806
72,619
377,011
284,195
205,788
20
Uzbekistan
205,502
419,673
272,604
102,598
252,138
241,235
195,745
21
Belgium
203,665
596,173
339,529
138,729
557,435
511,559
419,998
22
Kuwait
163,496
480,123
246,249
120,221
374,191
298,620
255,644
23
Jordan
154,121
494,629
326,633
93,750
474,874
406,469
277,729
24
Sweden
149,541
415,696
192,872
93,703
444,285
384,397
289,134
25
Austria
153,589
454,638
284,095
112,126
401,475
353,628
287,746
26
Lithuania
128,735
251,619
114,227
14,194
229,704
199,371
134,264
27
Switzerland
127,715
382,835
219,591
127,643
311,107
269,649
206,479
28
Spain
125,556
298,165
104,848
54,381
257,342
178,018
106,757
29
India
123,424
231,579
52,651
44,707
230,131
147,127
86,996
30
Belarus
115,961
239,966
220,932
106,426
258,419
245,254
229,229
31
Denmark
115,554
356,127
111,499
44,694
335,877
326,278
269,026
32
Serbia
114,942
357,787
238,852
129,284
282,347
225,312
146,852
33
Morocco
111,856
251,708
121,333
67,775
234,264
176,538
114,155
34
Algeria
109,395
210,478
48,827
50,121
295,512
288,207
213,333
35
Czech Republic
108,177
295,454
89,734
15,642
311,359
228,251
126,567
36
Moldova
104,442
274,257
192,441
109,137
198,867
194,268
171,538
37
Macedonia
97,872
266,184
182,045
115,483
222,862
209,519
172,851
38
Canada
95,324
197,416
72,034
34,210
139,164
108,272
81,196
39
Indonesia
95,314
152,995
49,319
36,690
127,149
119,337
85,031
40
Lebanon
94,757
272,844
191,768
89,337
376,721
338,837
237,476
41
China
88,965
89,515
33,641
40,264
426,344
394,109
247,277
42
Cyprus
85,998
182,945
68,353
59,808
268,341
266,859
256,059
43
Libya
81,202
220,179
197,983
107,251
259,243
188,312
99,395
44
Kyrgyzstan
79,794
147,487
102,840
52,142
121,364
114,926
104,911
45
Egypt
79,654
227,850
124,483
68,936
177,655
148,943
100,971
46
Norway
76,676
191,789
54,633
25,100
208,330
161,789
116,180
47
Tunisia
73,565
206,714
126,970
57,563
172,587
142,372
111,627
48
Australia
70,271
118,847
15,674
15,109
120,837
96,488
77,153
49
South Korea
70,170
99,869
15,206
36,636
212,970
159,354
120,622
50
Kosovo
68,998
193,823
145,931
70,462
152,048
139,500
116,049
Frequently Asked Questions
How many tourists visited Turkey in 2023?
26.76 million tourists visited Turkey in 2023 (the first 7 months).
Which country visits Turkey the most?
Russia is the leading inbound travel market for Turkey in 2023 as of first half of the year, with 2.6 million tourist arrivals.
Is Turkey the most visited country in the world?
Turkey is not the most visited country in the world; it ranks fourth, with France being the most visited country.